Calculating Risk Across Project Real-estate using Graph Analysis
Prioritising remediation of vulnerabilities based on effective impact and risk using PageRank.
It’s not uncommon for vulnerabilities to mount up in your code base until you just don’t know how best to address the problem. Teams are trying to release new features and the work on security fixes seems to require more and more effort. So getting the best bang for your buck and to see the wood from the trees, I got thinking.
I began searching for answers to the following questions:
- When overwhelmed by the number of security vulnerabilities, where should we start?
- What would I need as a metric to make that decision?
- How would I get it?
Information Gathering
I first needed to understand our ecosystem and the inter-dependencies between projects. I would need to create a graph to see these dependencies. Where could I gather the data I needed to create this graph? To gather the dependency information, I used the API of our Software Composition Analysis (SCA) tool.
Would parsing the dependency management files have been a better solution for constructing the graph? Not in our case, both the diverse set of programming languages and the nesting of the files would’ve made this approach very complex. You should choose whatever works best for you.
Initial Intuitions
Looking at the graph, centrality seemed to have the biggest impact. Let me explain with a diagram:
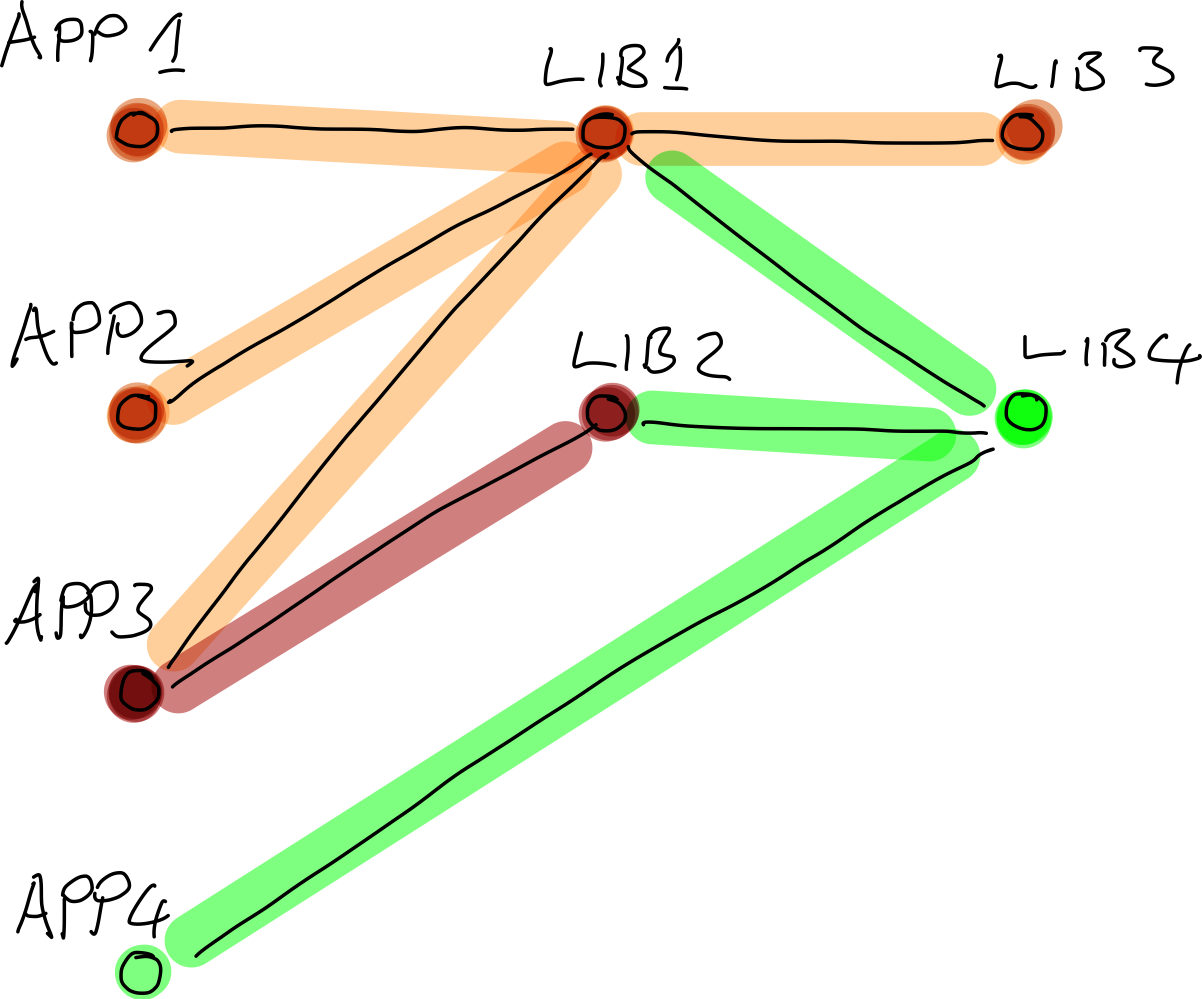
- Note:
- The above example is a directed acyclic graph (DAG).
We can see that Lib 1 has the most connections. So if it has a vulnerability, that vulnerability will also affect all its incoming connections. So I started thinking we should prioritise the vulnerabilities of projects with high centrality. This is an improvement and fixing an issue with Lib 1 or any 3rd party library seems like an excellent strategy and it would speed up remediation. I still wasn’t 100% convinced that I had found the optimal solution, yet.
Second Approach
A component with low centrality, when connected to one with high centrality, would still have a high impact. So we must take care not to overlook these high-impact components. Centrality, although an important factor, is not the whole story. There’s something missing?
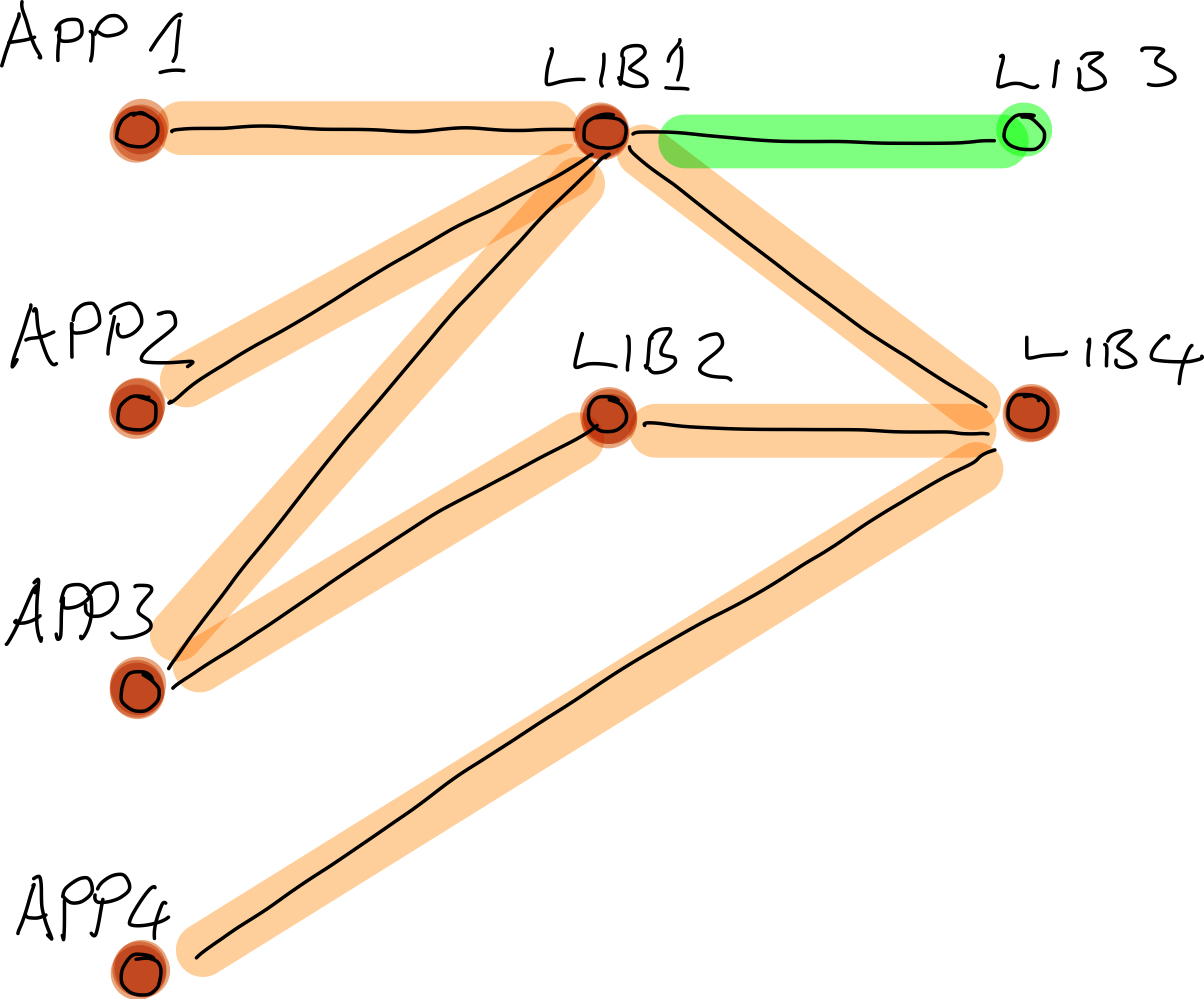
Let’s look at the effect of a vulnerability in Lib 4. We now see that yes, the centrality of Lib 1 has an effect, but it isn’t the point in the diagram that has the greatest impact. So what metric is that, the one that distinguishes Lib 4 as having the greatest impact? The answer seems to lie in the number of paths through the graph that lead to that library, i.e., the number of its transient dependencies.
Can we order the vulnerable components by the number of associations they have? Perhaps breadth-first or depth-first traversal of the graph, collecting the paths to each node would be the way? Investigating this, I discovered I needed to use PageRank. The algorithm developed by Larry Page at Google for ranking search engine results.
This whole process has been one of learning and I learned that PageRank although better than just inward centrality is also not the right solution. PageRank was invented for finding the most probable page where you would end up when navigating the web and so a node with few inward connections even when connected to one with many may have an inferior PageRank.
So to conclude the metric we were really looking is the total number of paths to a node relative to the total paths to the other nodes.
What next?
If we rank the vulnerabilities in our ecosystem based on their geographic location in the graph, we can use this to optimise remediation of issues and to estimate the impact.
To could calculate this use, the following steps:
- For each application, multiply the asset value of its data by its respective exposure factor to get the Single Loss Expectancy SLE
- Remove any outliers on the lower bounds
- Sum these values for all the applications
- Multiply the pagerank value by the CVSS severity / 10
- Use the output of the above calulation and multiply it with the sum of the SLEs
This will give you a rough estimate of the impact each vulnerability could have on the data and it will also give you their relative impact against each other.
Now you can prioritize where to concentrate you effort.
Glossary
- Directed Acyclic Graph (DAG)
- A graph where the connections have direction, so A -> B does not equal B -> A, and there are no loops such that A -> B -> C -> A